
Much like a crock pot used to cook large meals with minimal effort, data science can be used to improve efficiency, quality, and edibility of your products. Automation, simple algorithms, and machine learning (i.e. using data to create predictive models) are all tools that can be utilized to increase efficiency and accuracy and reduce costs, while visualization techniques help to communicate your analyses clearly and in an easy to digest way.
As a result, the psychology community would benefit from incorporating data science techniques into its work and into the foundation of psychology curricula. These techniques are quick to learn, reliable, and hardly the magical sorcery that they seem at first glance. Despite this, there are many who are too intimidated to begin using data science, while others might believe that simply using data is intrinsically “data science”.
To address these barriers, I will examine the definition of “data science” and walk through an example of how the American Psychological Association’s Center for Workforce Studies used a data science approach to improve the efficiency, objectivity, and accuracy of one of our recent projects. Additionally, because the best way to start using data science is to do it early, I will also stress the importance of updating psychology curricula to include data science techniques and methods.
What is “data science”?
The term “data science” was coined in 2001 by William S. Cleveland as part of his action plan for the technical areas of statistics and the role of the data analysts. Essentially, “data science” referred to the contribution that data analysts make to the scientific community and the opportunity that exists within that space for collaboration and growth.
The term is defined in the Journal of Data Science as “almost everything that has something to do with data. . . the most important part [being] its applications.” Modern data science is just as broad – it spans everything from traditional statistics to data analytics and machine learning to visualization and communication. However, it has several core elements that can be found across sources such as Python for Data Science for Dummies and a recent report Data Science for Undergraduates produced by The National Academies of Sciences, Engineering, and Medicine.
These core elements include the following:
- Data science is multidisciplinary. It involves the use of several broad fields to extract information from a data set, usually a large and complex one, and subsequently use and disseminate that information. The approach integrates the collection, storage, cleaning, analysis, and visualization of data, creating predictive models, and much more, all to improve data use.
- Data science makes predictions. Data science incorporates the use of predictive models to extrapolate information from what is already known. In this way, machine learning is inextricably linked with data science and its modeling methods to take a step beyond mere data analysis and descriptive statistics.
- Data science is evolving. The growth in data science as a field has led to a growth in the scope of subjects that it encompasses including advances in data and information literacy, data use ethics, data privacy, and results communication. This requires the incorporation of these concepts into the professional and educational pipeline alongside the basics of programming, statistics and modeling.
Each of these elements integrate well with and contribute to the desired student outcomes laid out in the APA guidelines for undergraduate psychology. At a minimum, incorporating data science into psychology education means incorporating in-depth curricula for “scientific inquiry and critical thinking”, “communication”, and “professional development” (Goals 2,4,5; APA, 2013).
Furthermore, the evolution of the job market and the growth of buzz words like “big-data” and “data science”, means that students entering the workforce with these skills and an understanding of those concepts and the ethics surrounding them have both an edge and a solid basis on which to build reliable, trustworthy research.
With all of this in mind, I’d like to walk you through an example of how we used data science to help wrangle a large text-based dataset into a manageable quantitative analysis.
Using a “data science” approach
The data we used consisted of nearly 7,000 job advertisements posted over the course of three years to APA psycCareers. Our goal was to examine the characteristics of these advertisements, from what types of jobs were represented to what qualifications and skills were specified.
In the past, it might have taken several interns several months to read through thousands of job advertisements and code them meaning to apply labels based on the text (i.e. a job ad might be labeled a “Faculty” job type in an “Educational” work setting, and so on). In this method, coders may have different opinions or biases, drift in their definitions over time, or make mistakes that are difficult to catch without investing an equal amount of time double-checking everyone’s work (this is also a great way to destroy a promising intern’s interest in science forever).
As such, performing an analysis can be difficult, expensive, and riddled with inaccuracies and the more parameters you add to the analysis, i.e. parsing out the type of job or required qualifications, the more likely you are to miss other key points or potentially forget to code the data at all.
To avoid that mess, we decided to take a data science approach. We took a sample of fifty advertisements and from them, created a decision tree for identifying and sorting the various components of each advertisement. This tree accepted lists of keywords and made labeling decisions based on the keywords present, where those keywords were found, and what other labels could also be applied to the advertisement.
Once we verified the results against the fifty original advertisements, we applied the decision tree to the whole dataset. Even with several iterations of double-checking results and adjusting the code for accuracy, this method was far more efficient. Additionally, now that we have the syntax written, we can easily replicate this analysis, and adapt it for use on other datasets.
Watch the video below for an example of how we used the decision tree to identify the job type for a sample advertisement.
Using a decision tree to determine “Job Type”
Concluding Thoughts
Incorporating data science into your research is more possible than you think, and it would definitely lead to more efficient and consistent data analysis than traditional methods. The data science approach that we’ve shown here is just one example where the quality of analysis can be improved, and quantitative methodology introduced, without losing the ability to make logical judgments about how the qualitative data is assessed.
By defining “data science” and providing this example, I hope to have demystified the approach for those researchers who, like me, may have found it too daunting or assumed that it required to much extra skill to use.
Additionally, I hope to have made a clear case for the incorporation of data science into psychology education, regardless of whether that occurs through institutional change or through a personal choice by the reader to add a data visualization or machine learning course to next semester’s schedule.
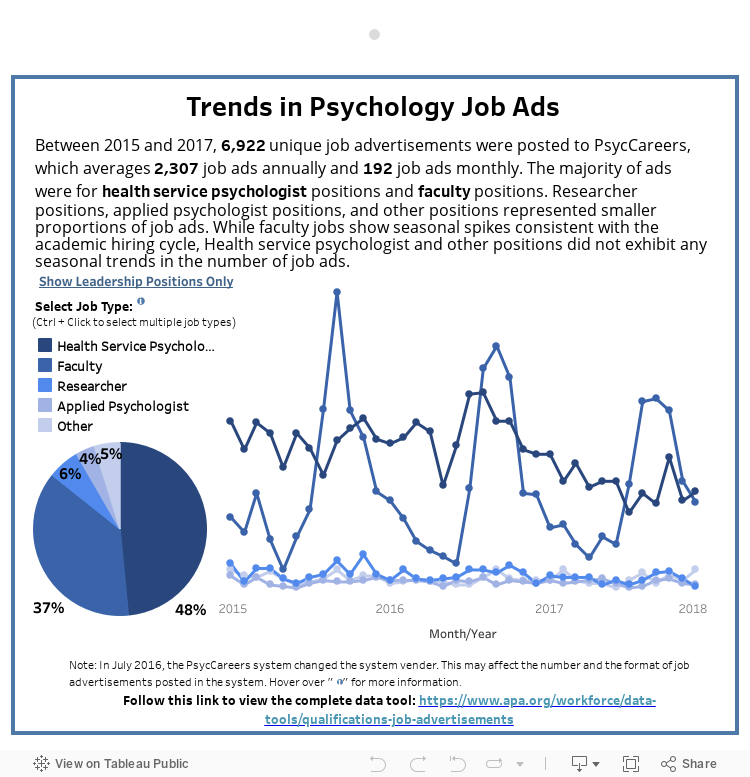
The portion of our analysis shown above allowed us to discover that most job ads, 48%, were for Health Service Psychologist positions, followed by Faculty positions (37%), Researcher positions (6%), and Applied Psychologist Positions (5%). For a more thorough look at what we were able to accomplish as well as documentation of the methods we used, see the completed reports and Technical Documentation, check out our data tools, or use the interactive dashboard below to explore trends in job postings for each job type!
Additional Resources
American Psychological Association. (2018). 2015-17 Psychology Job Advertisements: An Overview. Washington, DC: Author. https://www.apa.org/workforce/publications/job-market
American Psychological Association. (2013). APA guidelines for the undergraduate psychology major: Version 2.0. Washington, D.C.: Author.
Cleveland, W. S. (2001). Data science: an action plan for expanding the technical areas of the field of statistics. International statistical review, 69(1), 21-26.
Foster, I., Ghani, R., Jarmin, R. S., Kreuter, F., & Lane, J. (2017). Big data and social science: A practical guide to methods and tools. Boca Raton: CRC Press, Taylor & Francis Group.
Massaron, L., & Mueller, J. (2015). Python for data science for dummies. Hoboken, NJ: For Dummies, a Wiley Brand.
National Academies of Sciences, Engineering, and Medicine. (2018). Data Science for Undergraduates: Opportunities and Options. Washington, DC: The National Academies Press. https://doi.org/10.17226/25104.
Zumel, N., & Mount, J. (2014). Practical data science with R. Shelter Island, NY: Manning Publications.


Loved this article. As a psychology student and someone interested in data science, I have been trying to figure out how the two can come together myself. Totally support data science being included in psychology education.
We’re glad you liked it. You might also like our newest post “Computational Social Science Skills”. It takes a look a how to incorporate similar CSS skills into psychology.